
May 29th, 2026
Introducing Visualize Mode
Your filters, against the whole market
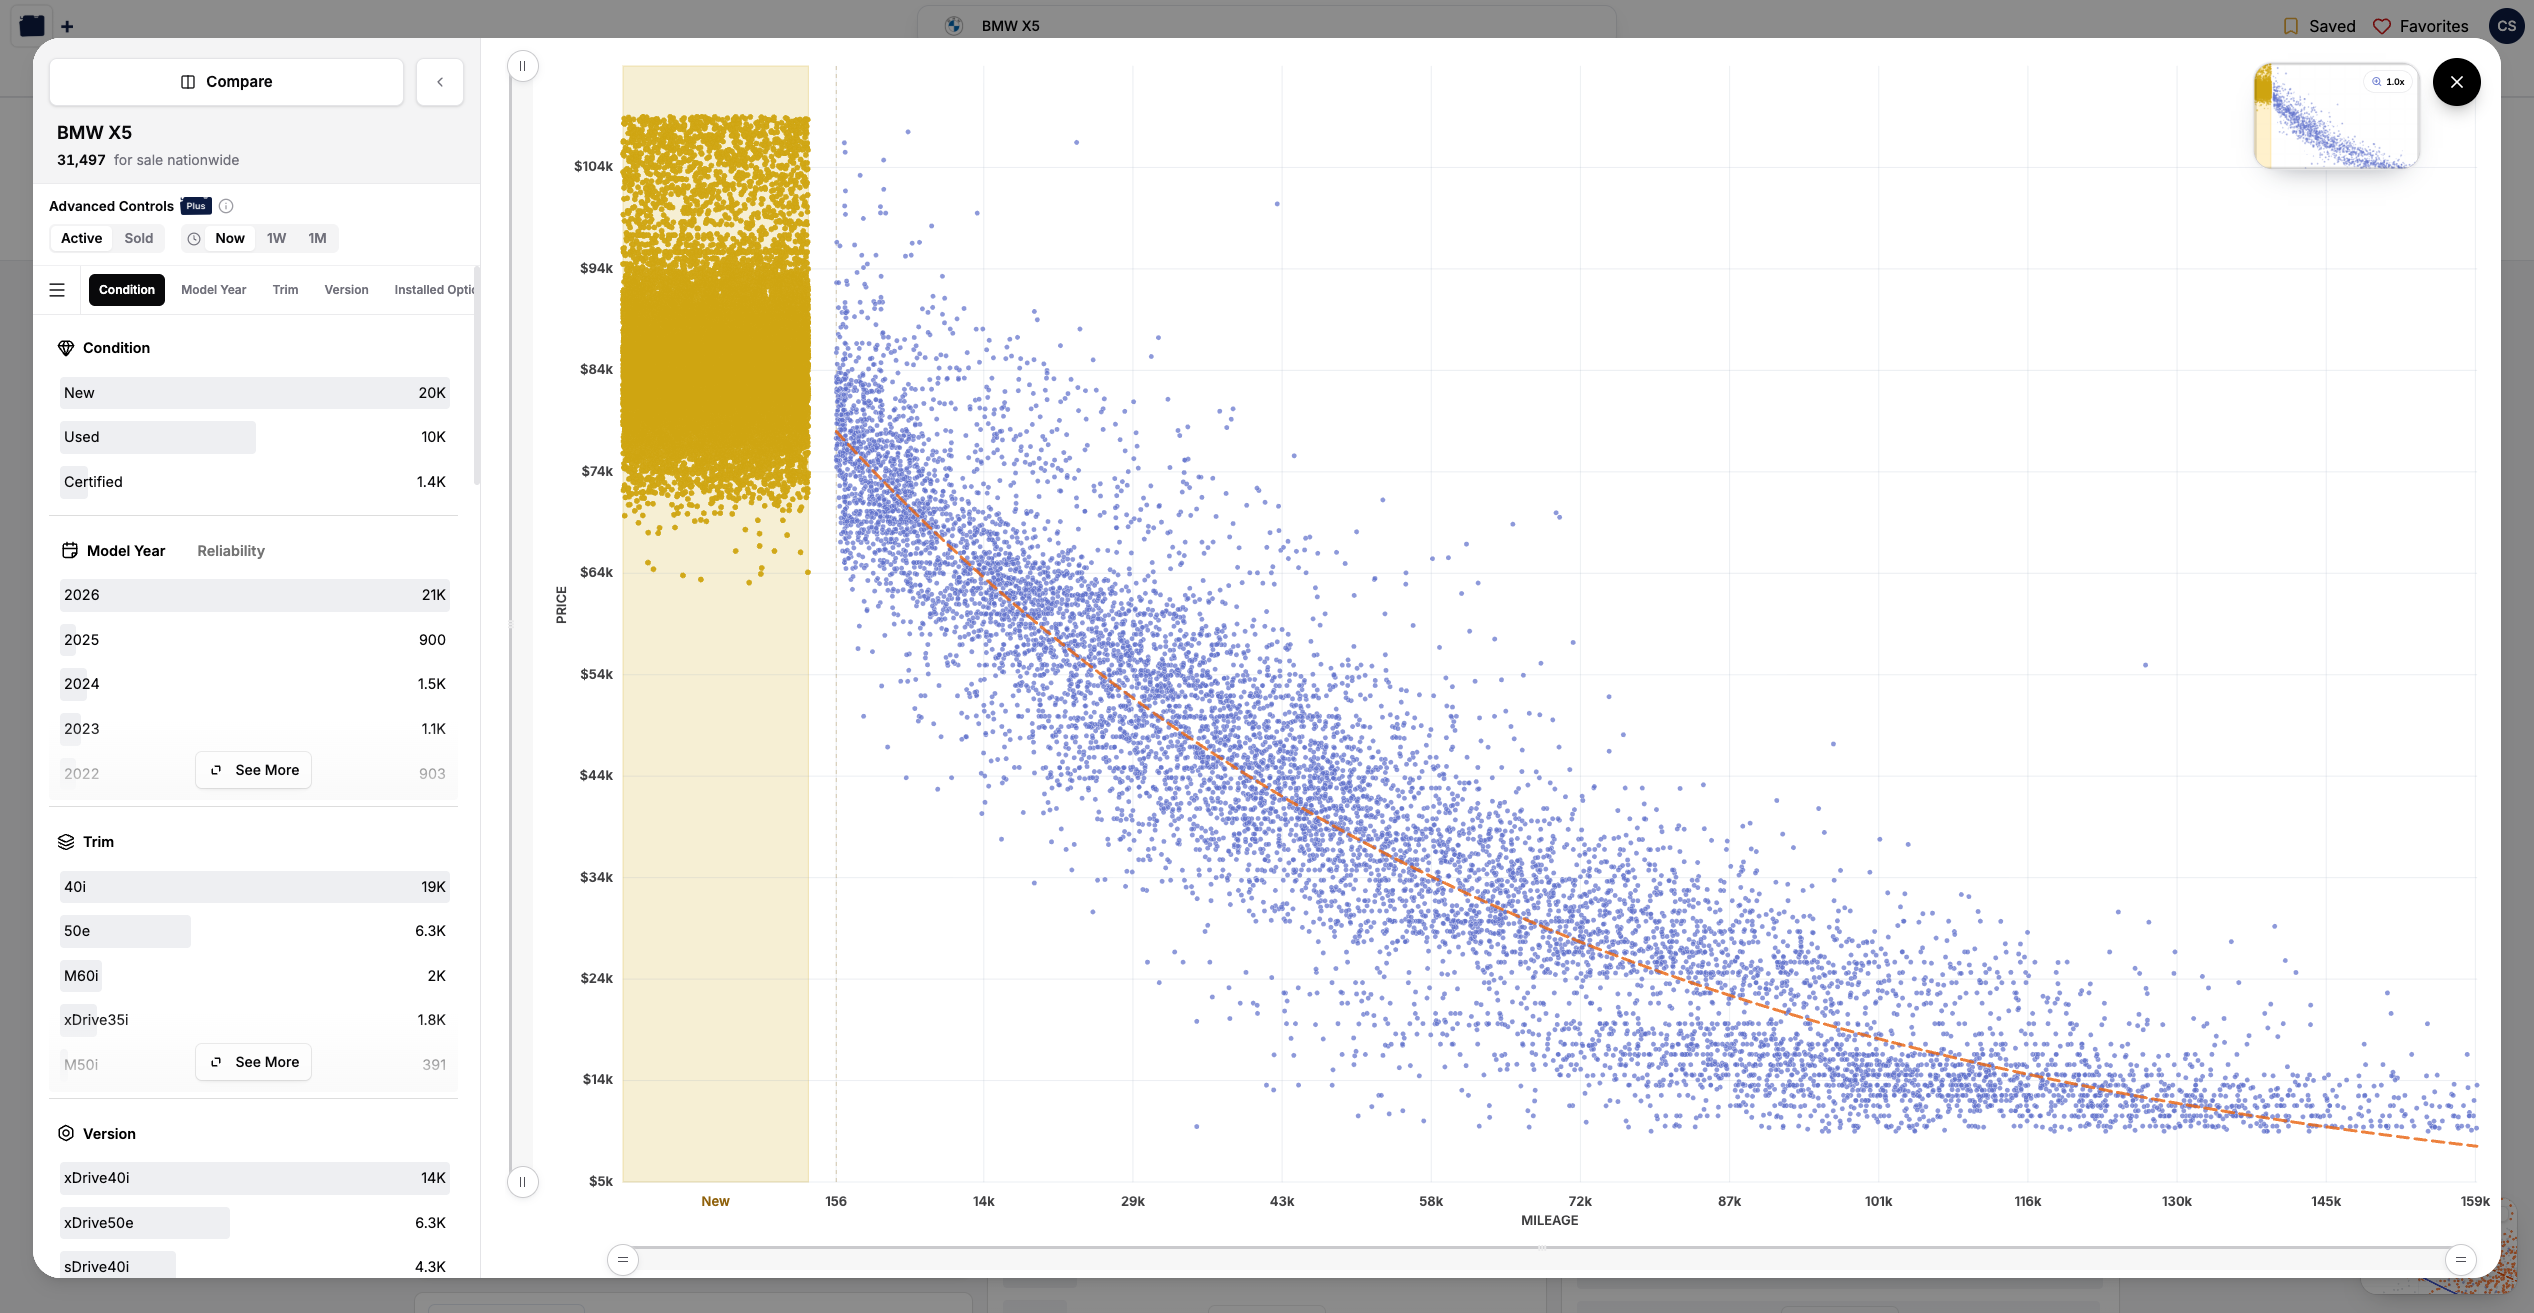
Open Visualize Mode from the filters page once you've narrowed down to a specific make and model (look for the button in the bottom-right). The colored dots are the listings matching your filters. The soft gray cloud behind them is the entire market for that vehicle, so you're never looking at your slice in a vacuum, you're seeing it in context.
Hover any point to pull up the listing. Use the minimap up top to zoom into a tight cluster, or zoom back out to take in the whole picture.
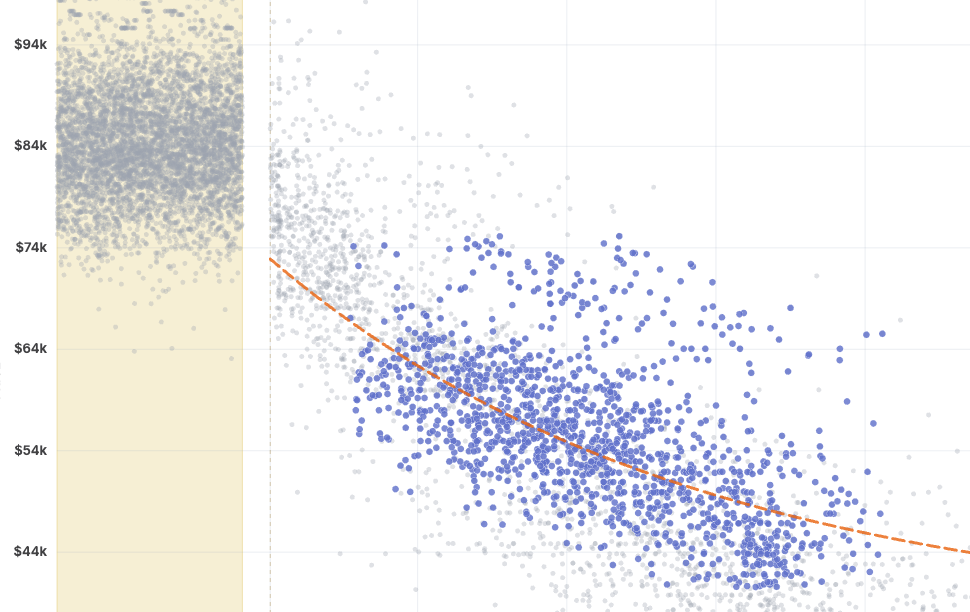
Follow the depreciation curve
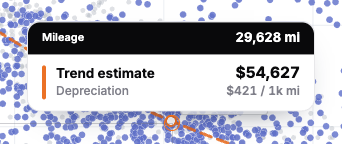
We fit a depreciation curve through the market so you can see, at a glance, how value falls off with miles. Hover anywhere along the line and we'll tell you the predicted price at that mileage, plus how much the vehicle is depreciating per 1,000 miles. It's a quick gut-check on whether a listing's asking price is keeping pace with the market, or running ahead of it.
Compare vehicles side by side
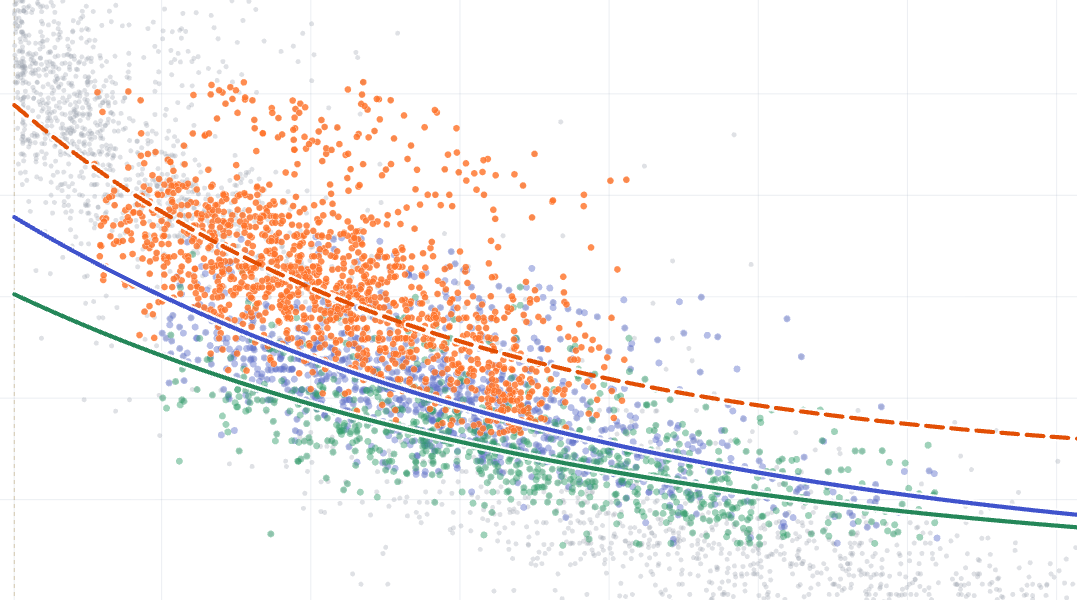
Cross-shopping two (or more) vehicles? Hit Compare and plot them on the same chart, each with its own color and its own trend line. Set up one cohort, then Duplicate it and tweak a single filter to see exactly how the two stack up... or point a cohort at a completely different vehicle (say, a Volvo XC90 against a BMW X5). The trend tooltip reads out every cohort's predicted price and depreciation at once.
Reshape the market with Advanced Controls
This is where it gets fun. With Advanced Controls you can:
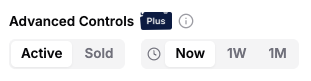
- Switch between active listings and the ones we estimate have recently sold, to see what the market will actually bear.
- Travel back in time to see where the market stood a week or a month ago.
Sold and historical figures are estimates rather than gospel, but they're awfully handy for sensing where things are heading. Advanced Controls are part of Visor Plus.
A note on the beta
Visualize Mode is launching in beta (you'll spot the little tag on the button). It's desktop-only for now, and we've got a long wishlist we're excited to work through. As always, the best way to shape what comes next is to tell us what you think.
What's next
- More to plot against, beyond price and miles.
- A brand new way to explore Visor's market data
- EV filters!
- A couple projects that have been in the garage for quite a while (they're going to be worth the wait)